안녕하세요 :)
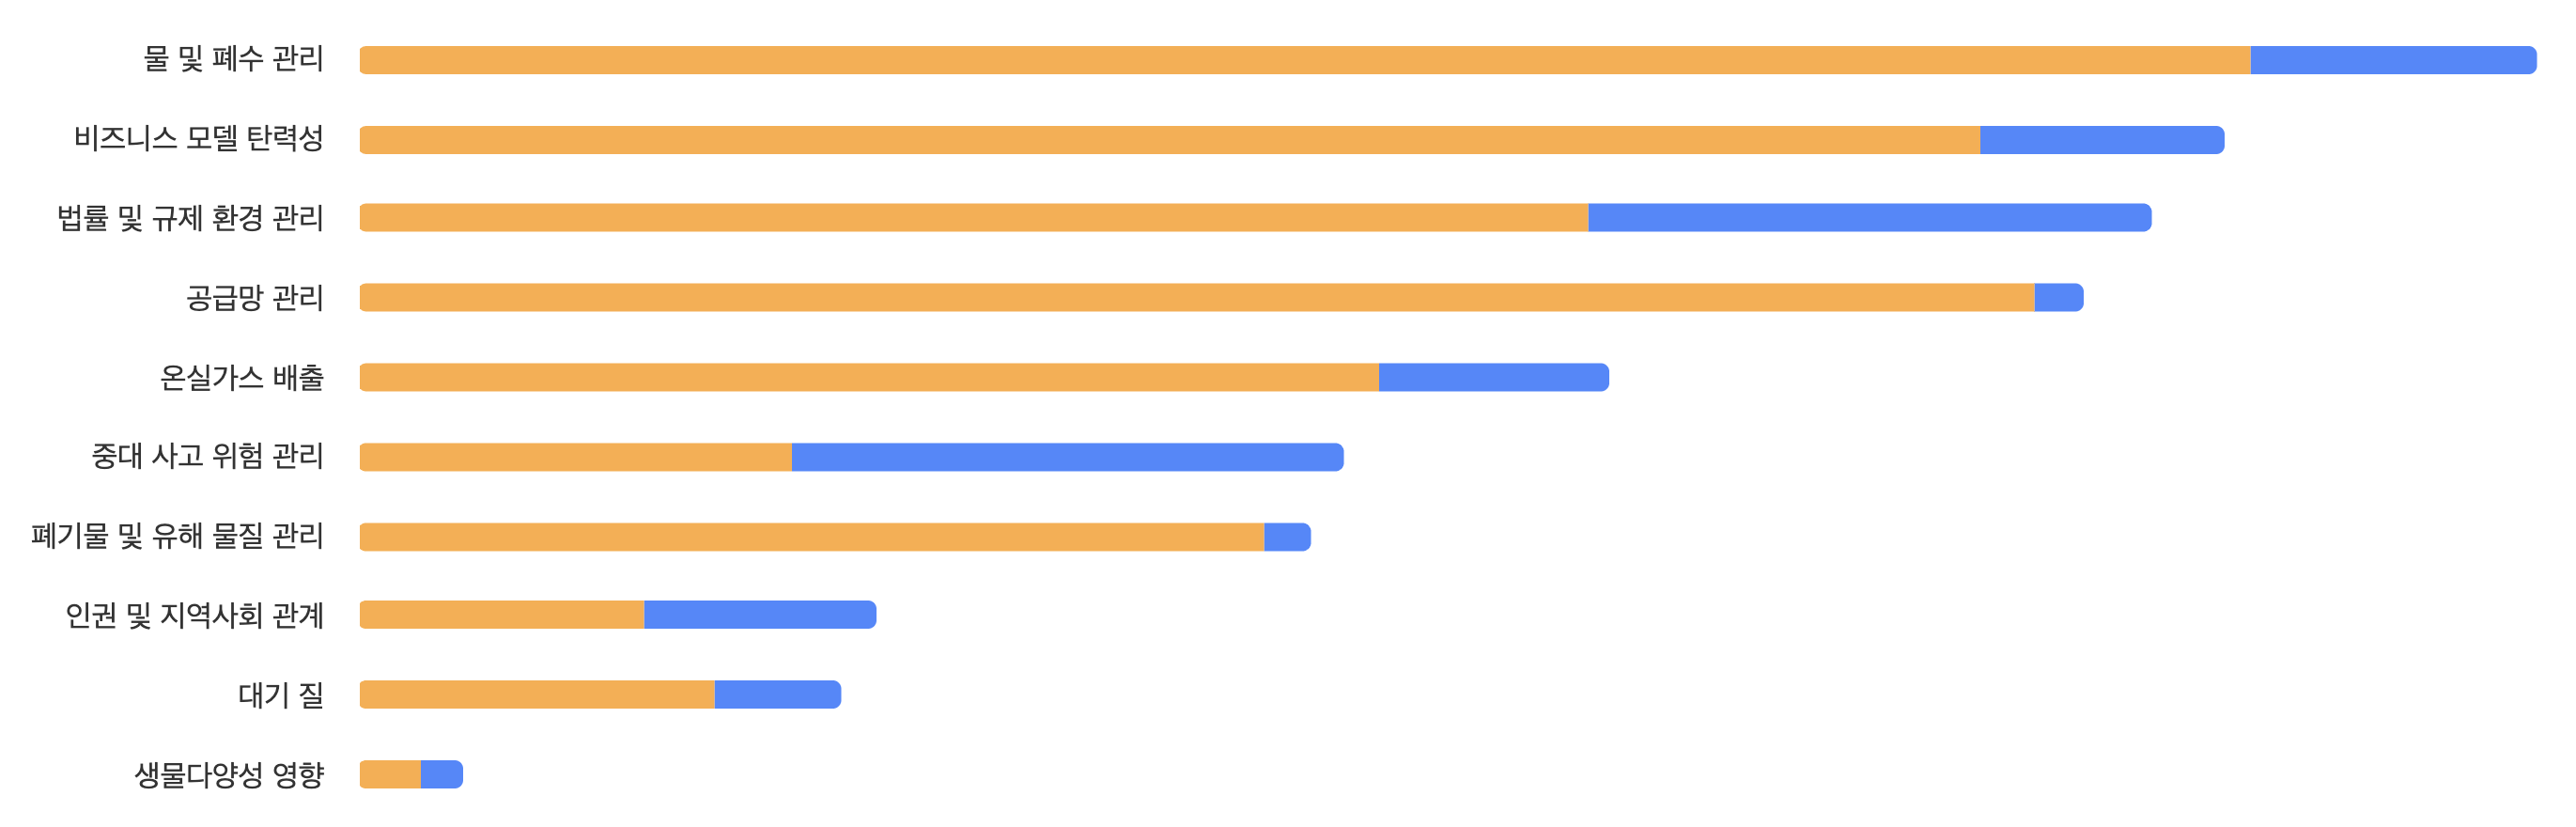
오늘은 바차트 ui를 만들었는데요, 디자이너님이 네 모서리 모두 예쁘게 둥근 바차트를 디자인으로 넣어주셨습니다.
그래서 아래와 같이 borderRadius값을 넣어주었는데요,
plotOptions: {
  bar: {
    pointWidth: 12,
    borderRadius: '30%',
    dataLabels: { enabled: false },
    stacking: 'normal',
    borderWidth: 0,
  }
},
문제는 radius 적용이 오른쪽 상단과 오른쪽 하단만 되는 것이었습니다.


highcharts 포럼을 뒤적이니 series에 borderRadiusTopLeft, borderRadiusBottomLeft 등의 값을 적용해 문제를 해결할 수 있다고는 나와있지만 documentation을 찾아보니 공식 문서에는 해당 속성이 없었습니다. 아무래도 옛날 버전에 있었던 모양입니다.
그래서 document를 더 자세히 들여다보니 아래와 같이 설명되어 있는 것을 확인했습니다.
borderRadius: number, string, Highcharts.BorderRadiusOptionsObject
The corner radius of the border surrounding each column or bar. A number signifies pixels. A percentage string, like for example 50%, signifies a relative size. For columns this is relative to the column width, for pies it is relative to the radius and the inner radius.
borderRadius 속성은 숫자나 문자열을 값으로 받는데 BorderRadiusOptionsObject도 값으로 받는다고 나와 있습니다.
그래서 BorderRadiusOptionsObject는 어떤 객체인고 찾아보니 "radius" "scope" "where" 이렇게 세 개의 속성을 가진 객체였습니다. 그리고 이 속성을 이용하면 개발자가 원하는 대로 좀 더 세세한 radius 설정이 가능하도록 되어 있네요.
자세한 설명은 아래 링크를 참고하시면 됩니다.
링크: https://api.highcharts.com/class-reference/Highcharts.BorderRadiusOptionsObject
Highcharts Interface: BorderRadiusOptionsObject
The border radius. A number signifies pixels. A percentage string, like for example 50%, signifies a relative size. For columns this is relative to the column width, for pies it is relative to the radius and the inner radius.
api.highcharts.com
그래서 코드를 아래와 같이 고쳐보았더니
plotOptions: {
  bar: {
    pointWidth: 12,
    borderRadius: {
      radius: '30%',
      scope: 'stack',
      where: 'all'
    },
    dataLabels: { enabled: false },
    stacking: 'normal',
    borderWidth: 0,
  }
},
아래처럼 원하는 결과가 나왔네요 :)
'Front-End > highcharts' 카테고리의 다른 글
| [Highcharts] "removePoint" 에러 해결 (0) | 2024.01.17 |
|---|---|
| [Highcharts] x축 날짜 표시 조정하기 (0) | 2023.10.04 |
| [Highcharts] Key events 플래그 만들기 (0) | 2023.05.22 |
| [Highcharts] 유연한 그룹핑 바차트 만들기 (0) | 2022.10.13 |
| [Highcharts] Getting started with Highcharts 3D support (0) | 2022.05.18 |


